Magdalen Thot 𓇼 ⋆.˚ 𓆉 𓆝 𓆡⋆.˚ 𓇼
Lives in the Crossfire: Civilians in the Sudanese Civil War
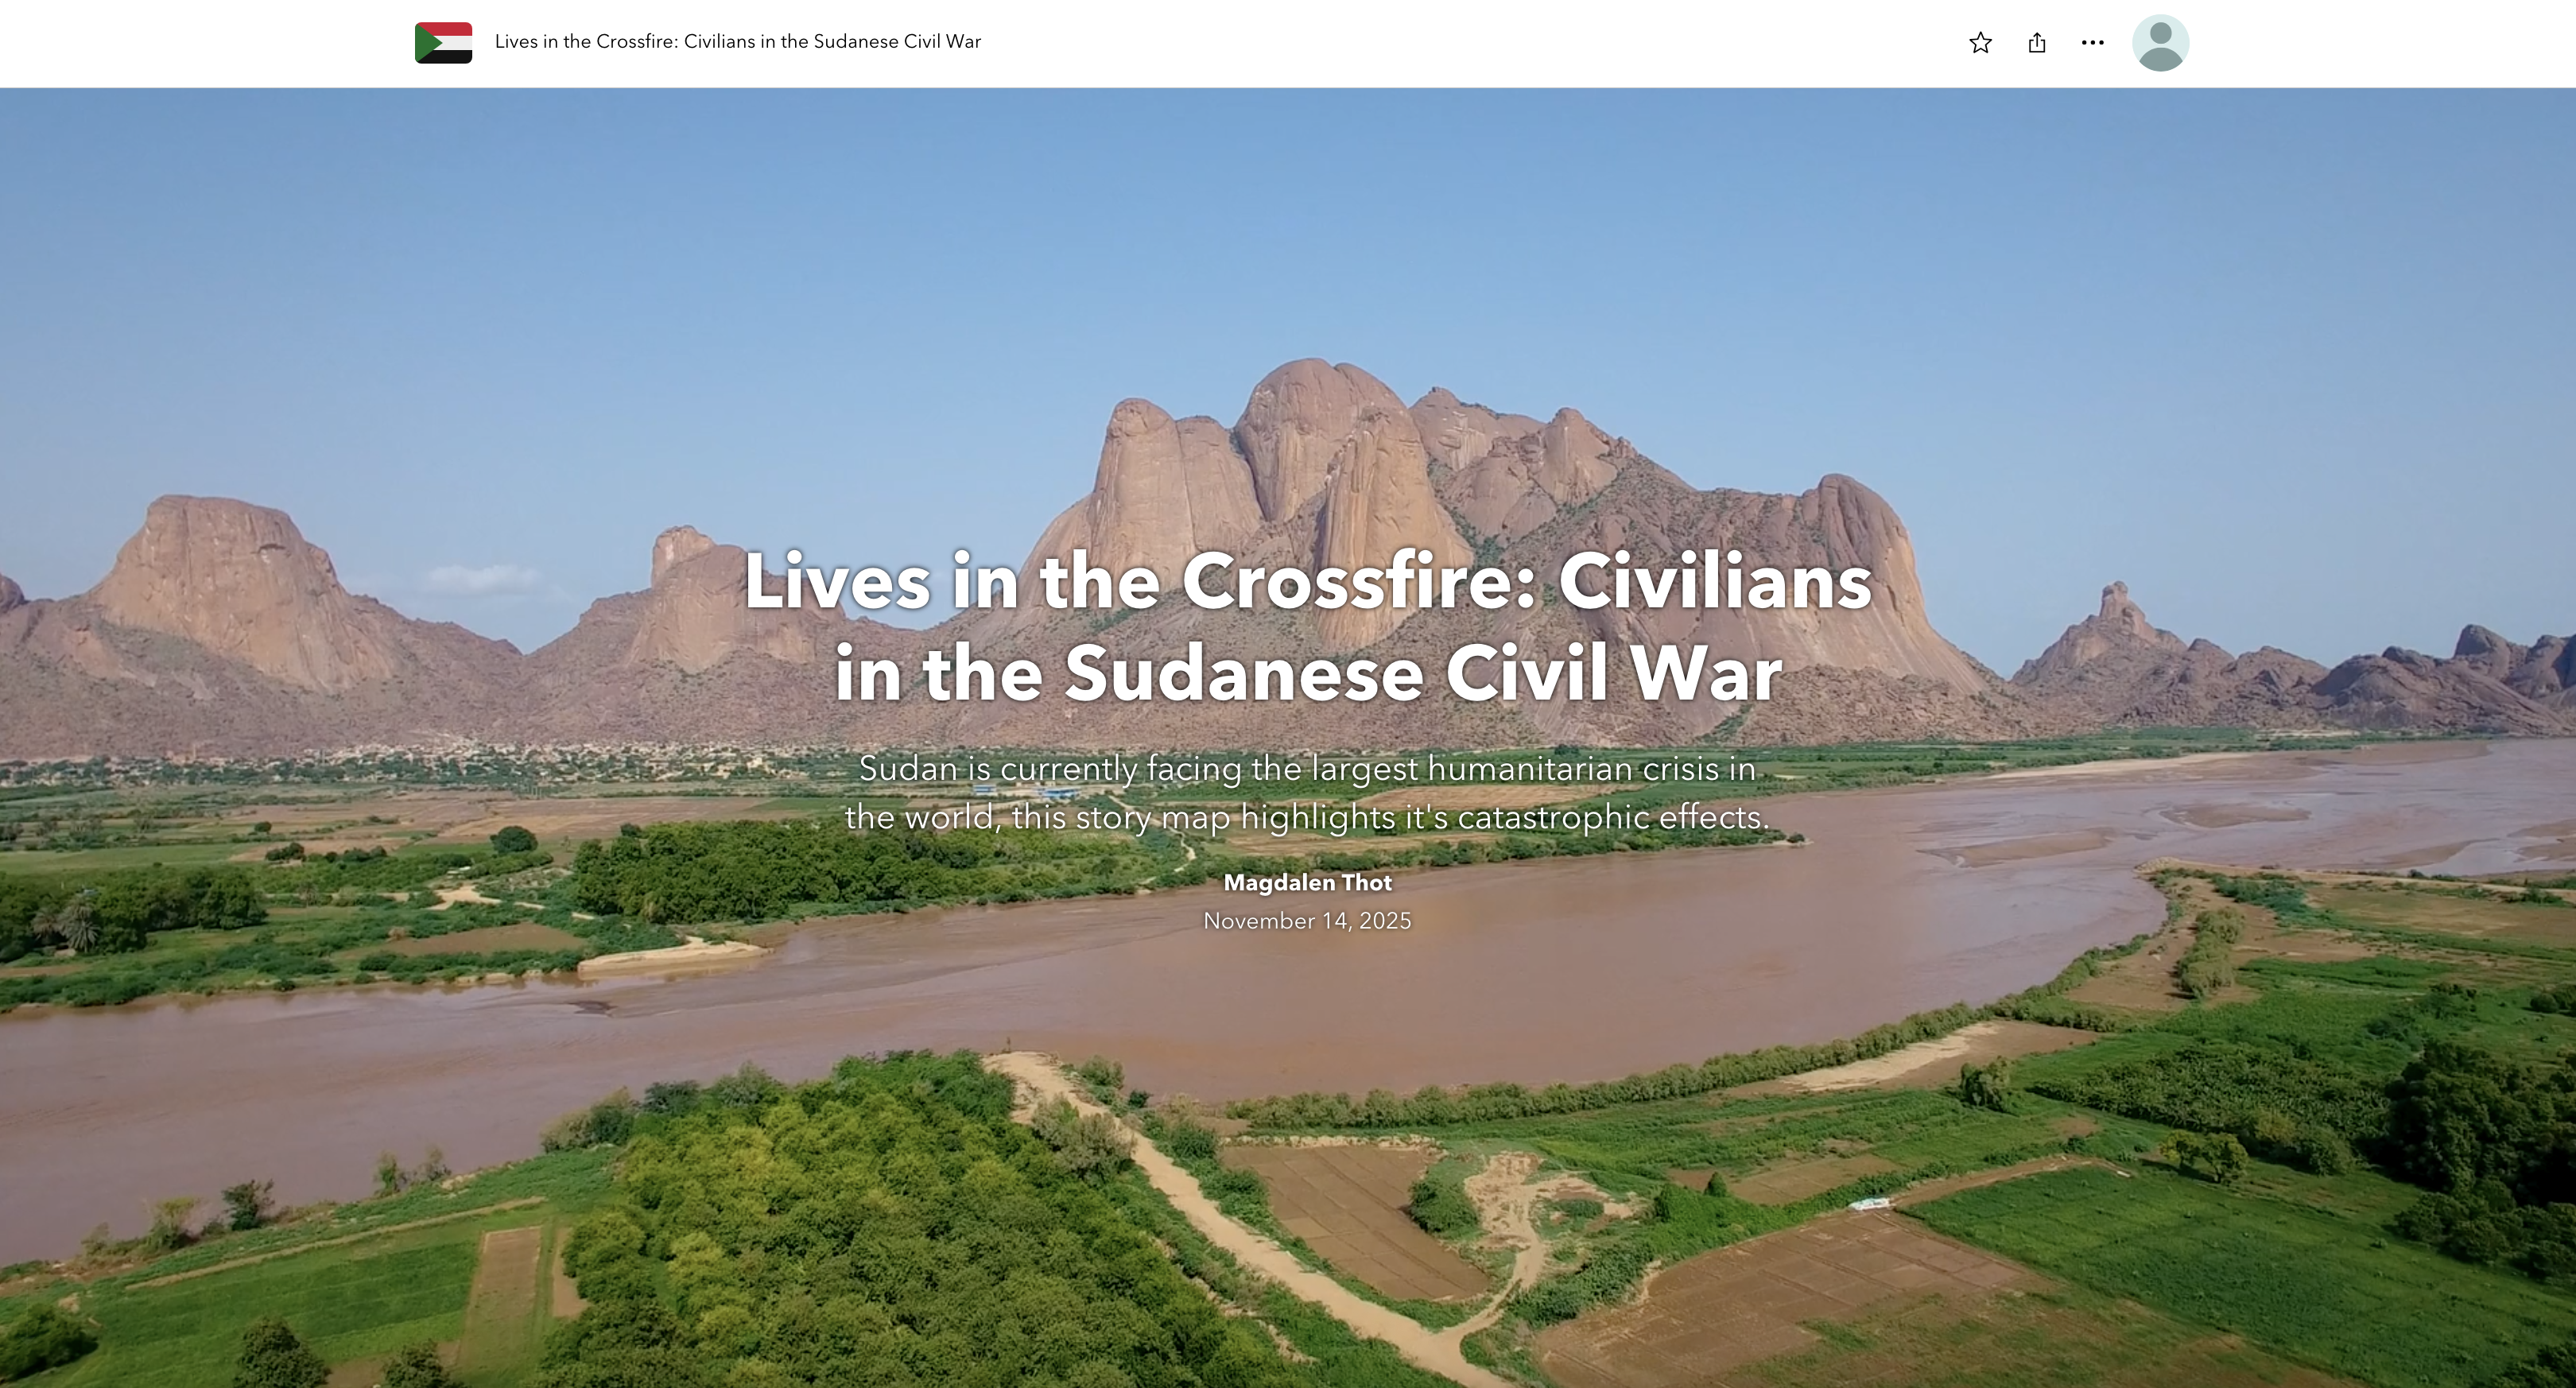
Created an ArcGIS StoryMap examining the catastrophic impacts of the Sudanese Civil War on civilians. The project highlights displacement, violence, and humanitarian access challenges in what is currently the largest humanitarian crisis in the world. This work was completed as part of the Humanitarian OpenStreetMap Team (HOT) Mentorship Program... Read more 01 Nov 2025 - less than 1 minute read
Hunger and Civilian Violence in Sudan
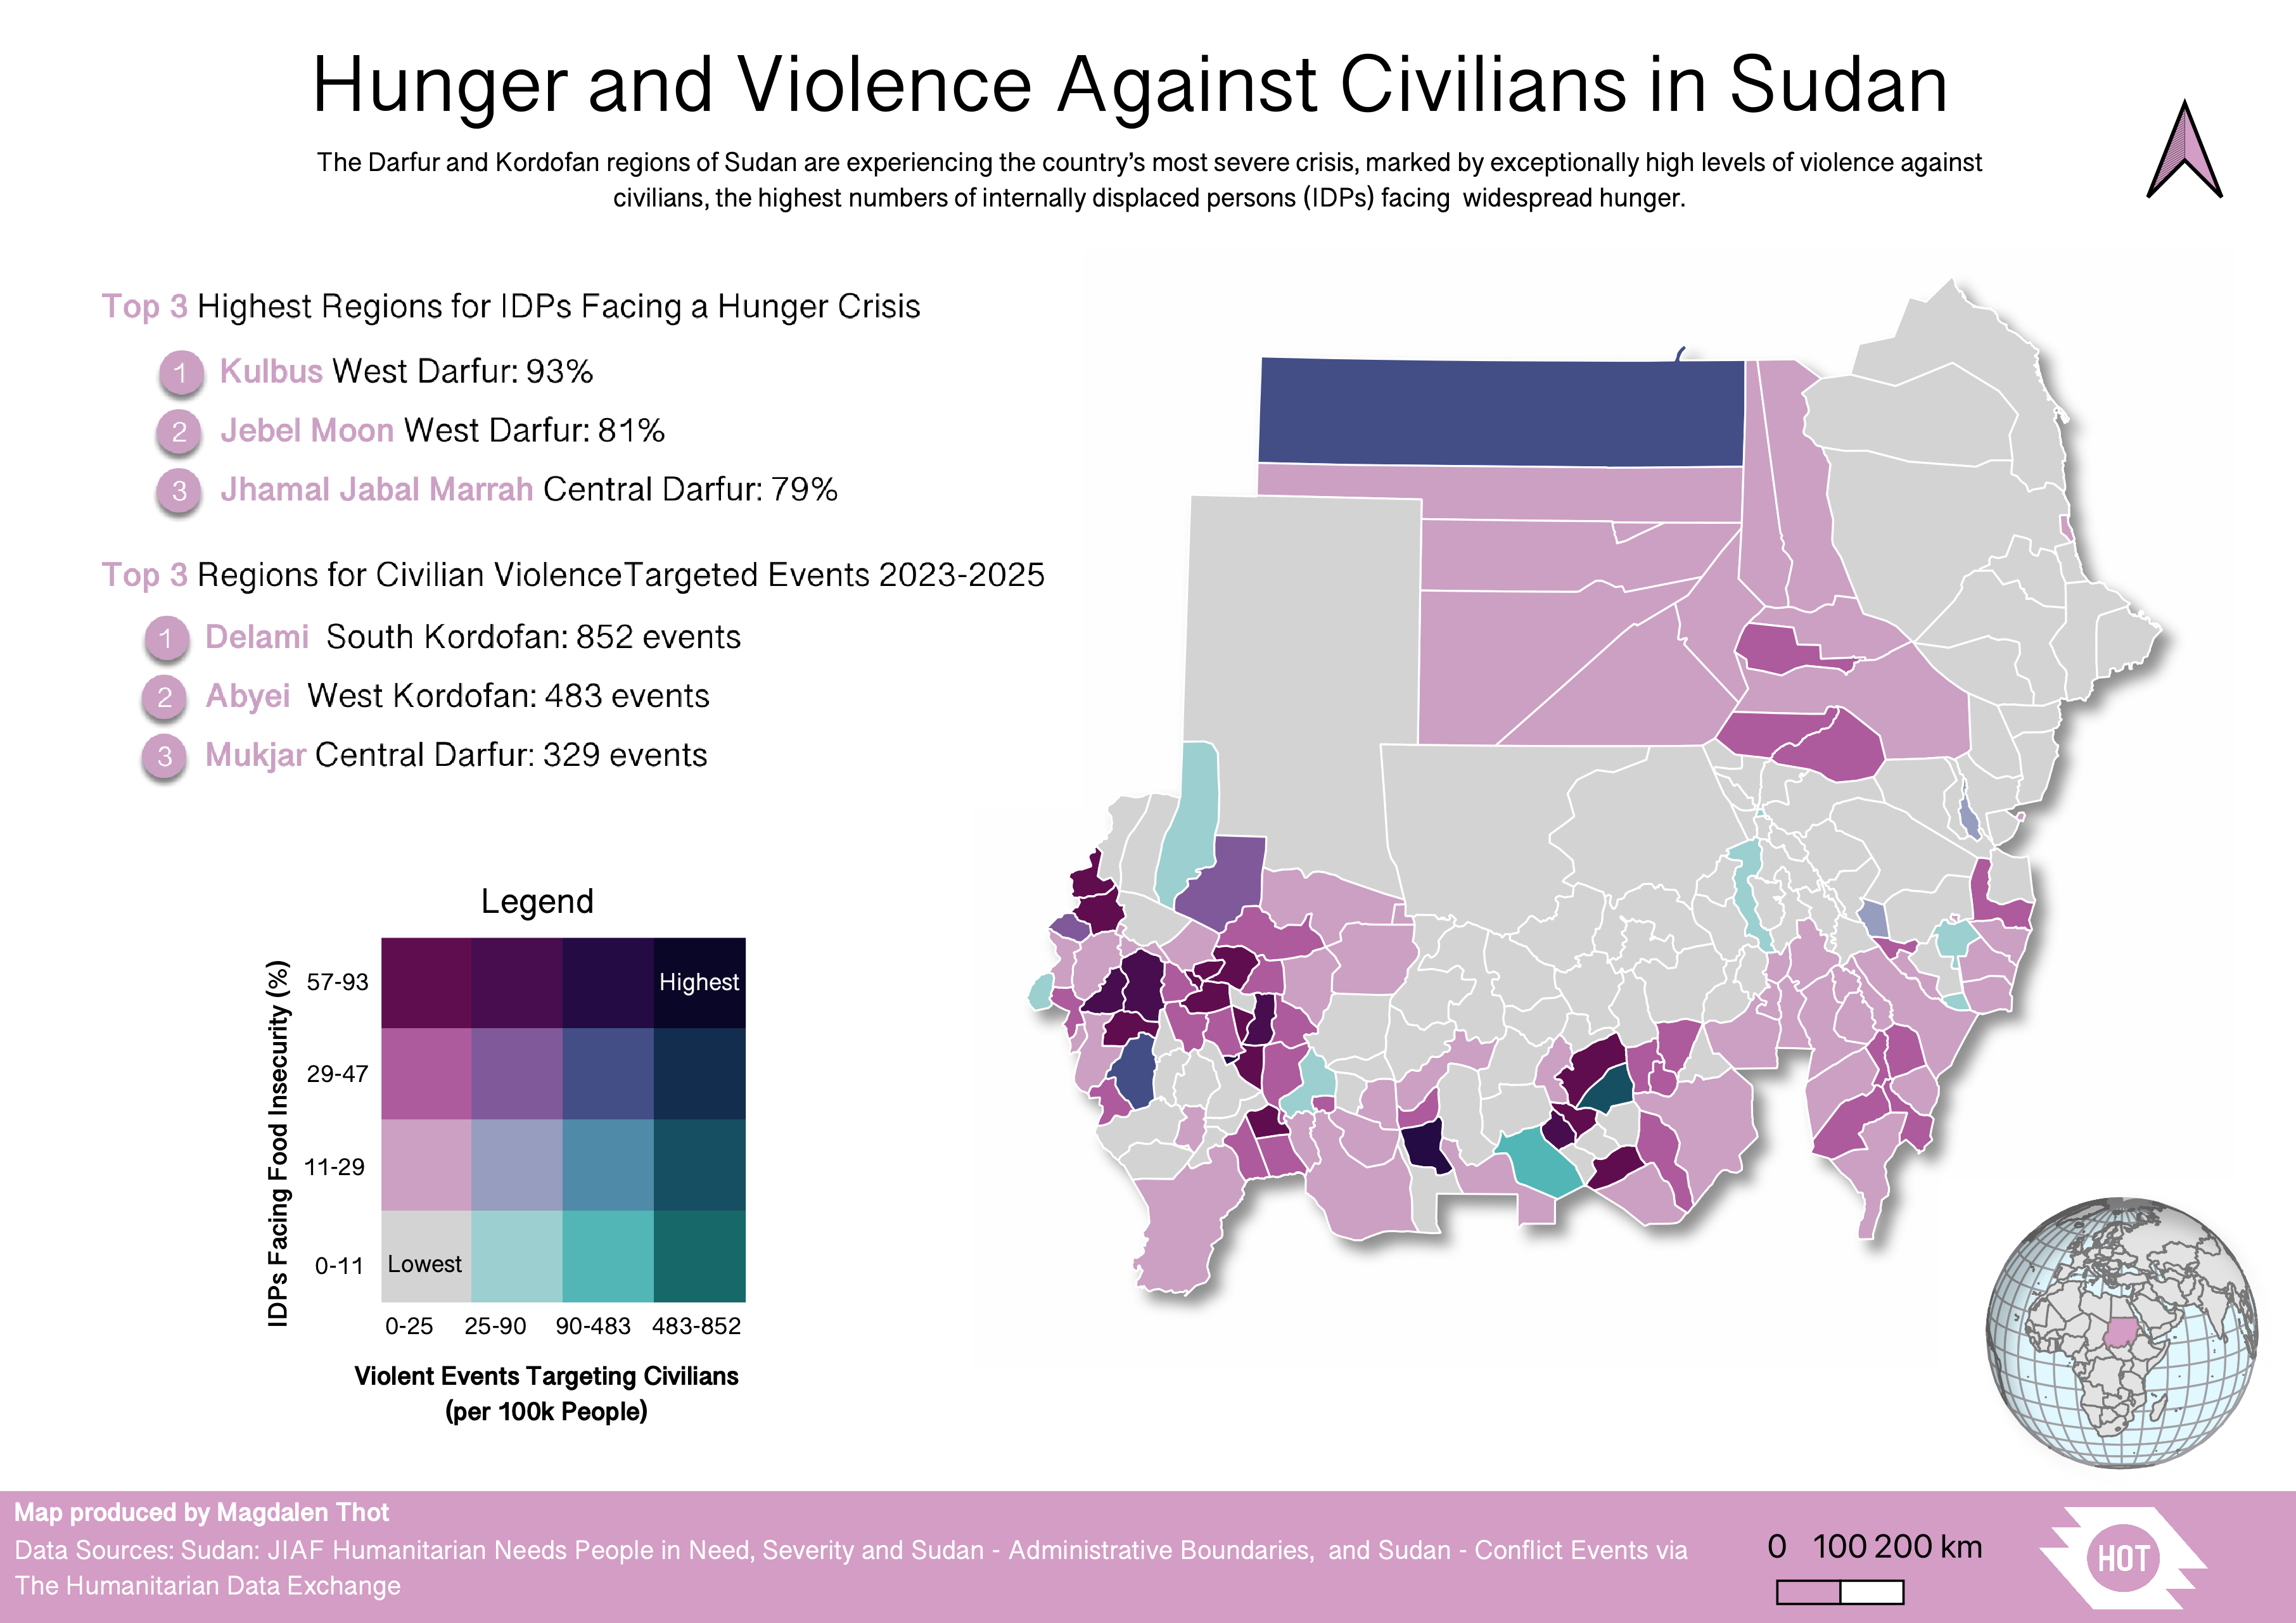
Developed a map highlighting the humanitarian crisis in Sudan for the Humanitarian OpenStreetMap Team’s mapping campaign using QGIS, Python, and Figma. The map was featured on the Humanitarian OpenStreetMap Team’s social media. Project Link Humanitarian OpenStreetMap Team – LinkedIn Feature Tools QGIS Python Figma Read more 10 May 2025 - less than 1 minute read
Community Mapping in Newfoundland

Developed a story map during my time at the Canadian Red Cross highlighting the importance of community mapping in Newfoundland. The project emphasized the use of the Social Vulnerability Index (SoVI) to assess disaster risk and inform disaster risk reduction strategies. Project Link (Internal project / Canadian Red Cross work) Tools Ar... Read more 01 Mar 2025 - less than 1 minute read
AI Study Planner
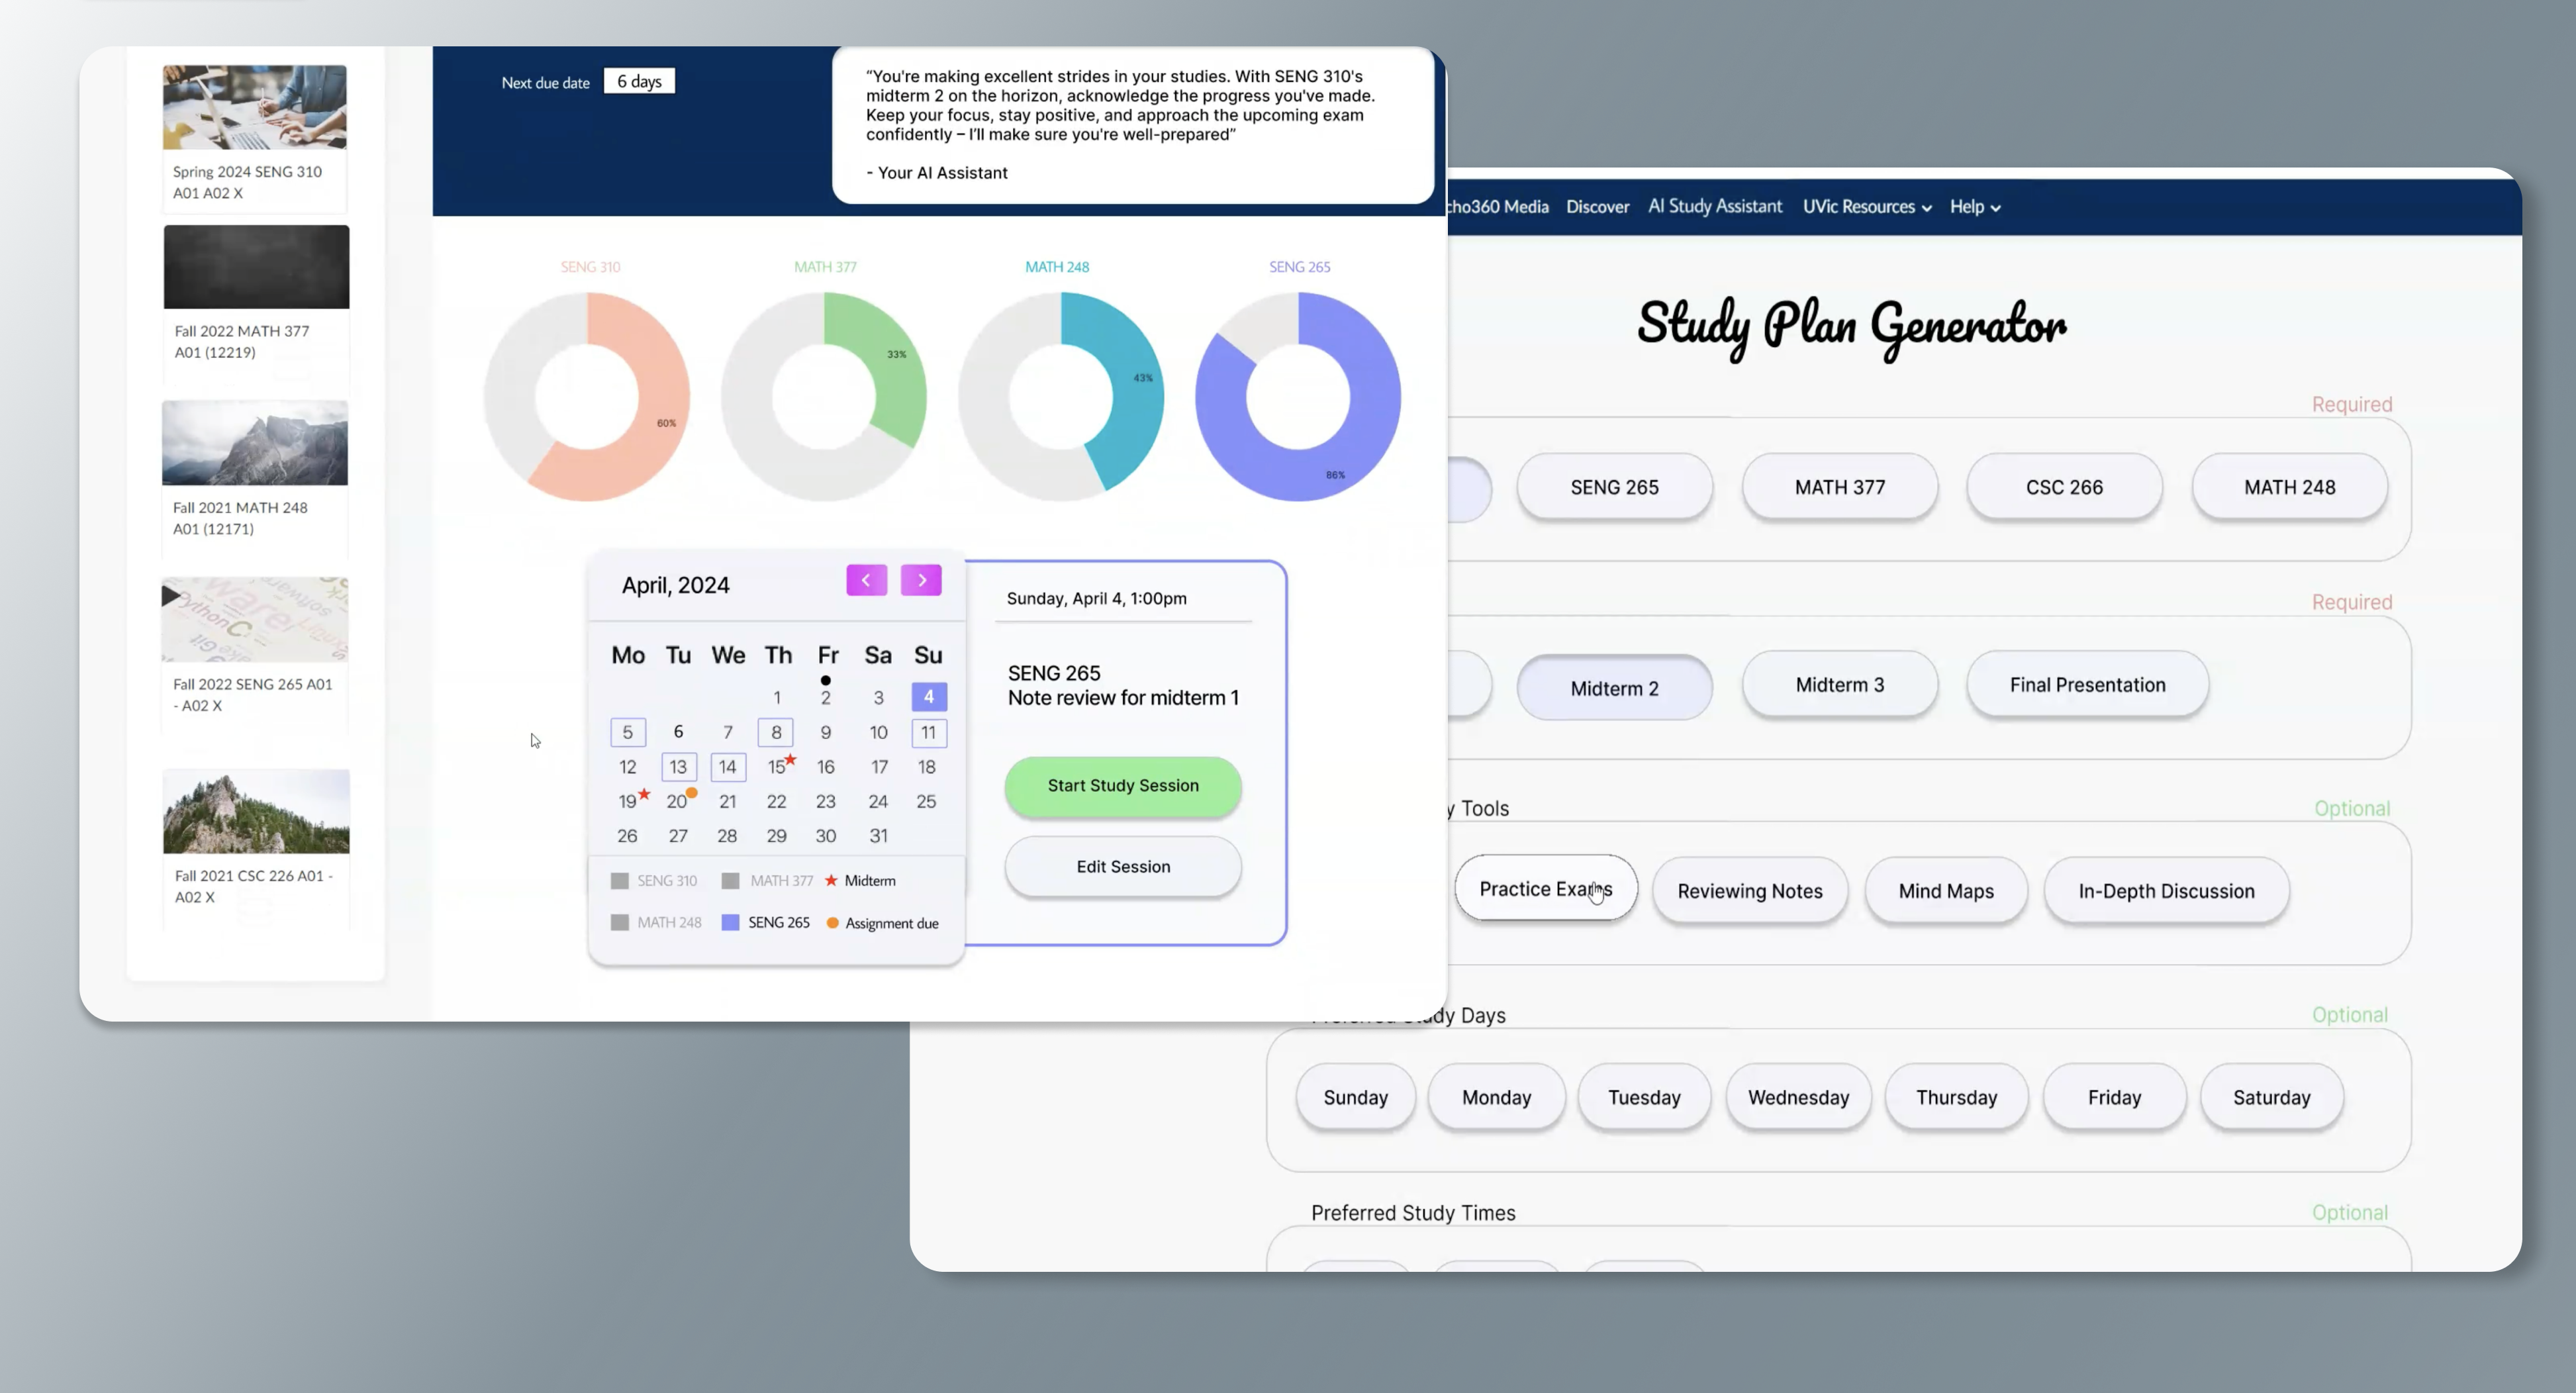
Designed an AI-powered study assistant for SENG 310: Human–Computer Interaction, following the full HCI process from interviews to high-fidelity prototyping. Final grade: A Project Link GitHub Repository Tools Figma HCI Principles Read more 10 Oct 2024 - less than 1 minute read
Chlorophyll Index Estimation in Turbid Estuarine Waters

Evaluated multiple spectral indices to estimate chlorophyll-a concentrations around Texada Island using Sentinel-2 imagery and in-situ data. Project Link Final Report (Google Drive) Tools Python Google Earth Engine Read more 02 Jul 2024 - less than 1 minute read
Eviction, Race & Gentrification in America
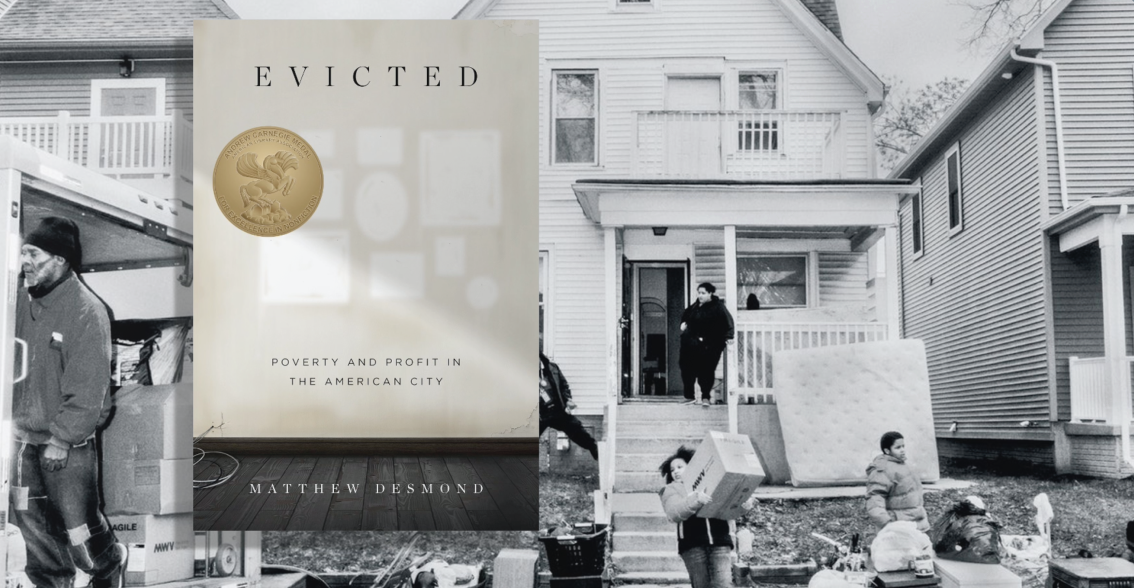
An interactive data visualization exploring eviction rates, race, and gentrification across the United States. Completed for CSC 411: Data Visualization. Final grade: A+ Project Link Live Shiny App Tools R Read more 04 Apr 2024 - less than 1 minute read
Data Physicalization of My Spotify Listening Habits
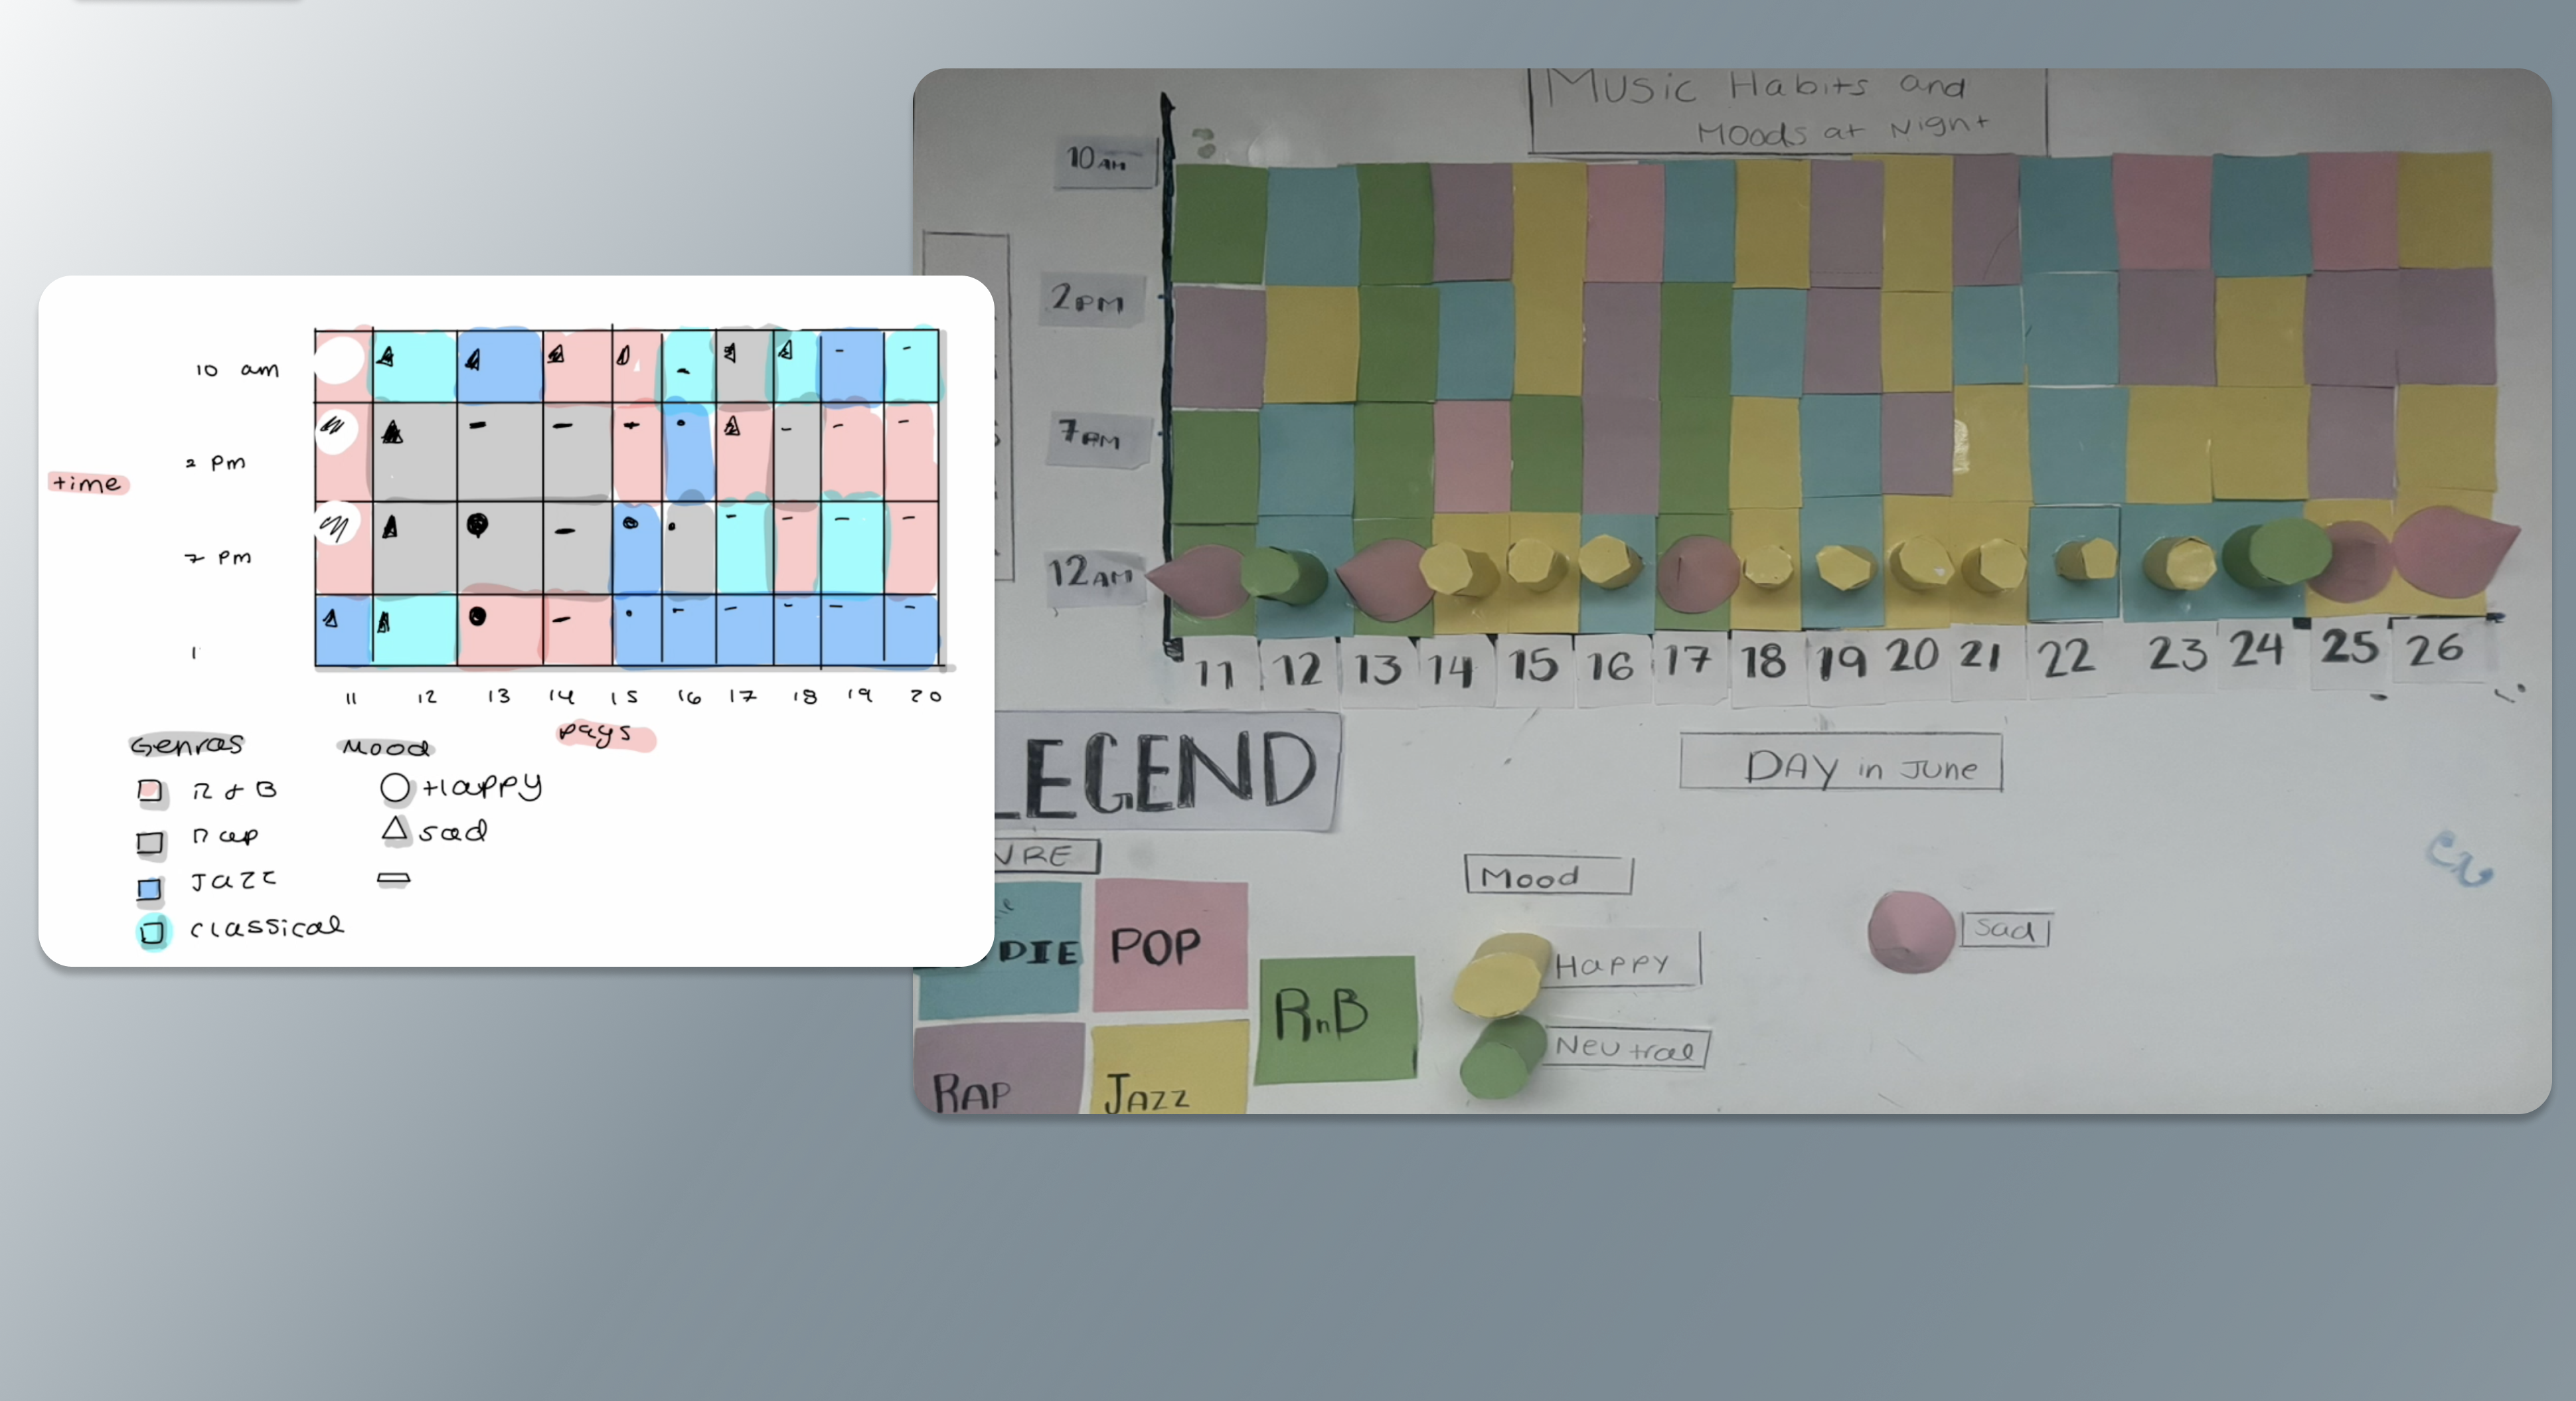
A physical data visualization representing two weeks of personal Spotify listening habits using non-traditional visualization methods. Tools Procreate Paper Data Visualization Read more 07 Mar 2024 - less than 1 minute read
Student Housing Solutions in Greater Victoria

A story map identifying optimal locations for student housing development in Greater Victoria to support planners, developers, and institutions. Project Link ArcGIS StoryMap Tools R ArcGIS Desktop ArcGIS Online Read more 01 Mar 2024 - less than 1 minute read